Modern-day business owners and freelancers need to regularly track their website’s marketing analytics and important data to see how users interact with their website. However, it can be quite tasking to do so manually, so an online reporting and analytics tool is required.
One of the major benefits of monitoring your website’s marketing analytics and valuable data is that you learn how well your website is doing and how customers interact with your product or services. You can see areas where improvement is required and take the relevant steps to work on those shortcomings.
Research has shown that 42% of companies want to prove their return on investment based on their marketing strategies. Hence, understanding how important data and analytics are in digital marketing is highly instrumental in today’s technologically advancing world.
True marketing analytics goes beyond monitoring your website data. It also involves monitoring your social media data, your email marketing, your ads, and so much more.
Sparrow Chart Inc. is an all-in-one reporting and analytics application that helps users easily track their marketing and sales data. On the platform, users can see the performance of their accounts on a dashboard or integrate data into their Google Workspace account.
What Users Need to Know About Sparrow Charts
Sparrow Charts is a great tool for monitoring and analyzing important marketing and sales data. Businesses and individuals can easily keep track of their website performance, social media pages, team performance, product or service performance, etc.
With Sparrow’s reporting solution, marketers can save precious time publicizing campaign results with clients. You can automatically input sales and marketing data into customized PowerPoint templates, create different web presentations, and easily monitor client marketing performance.
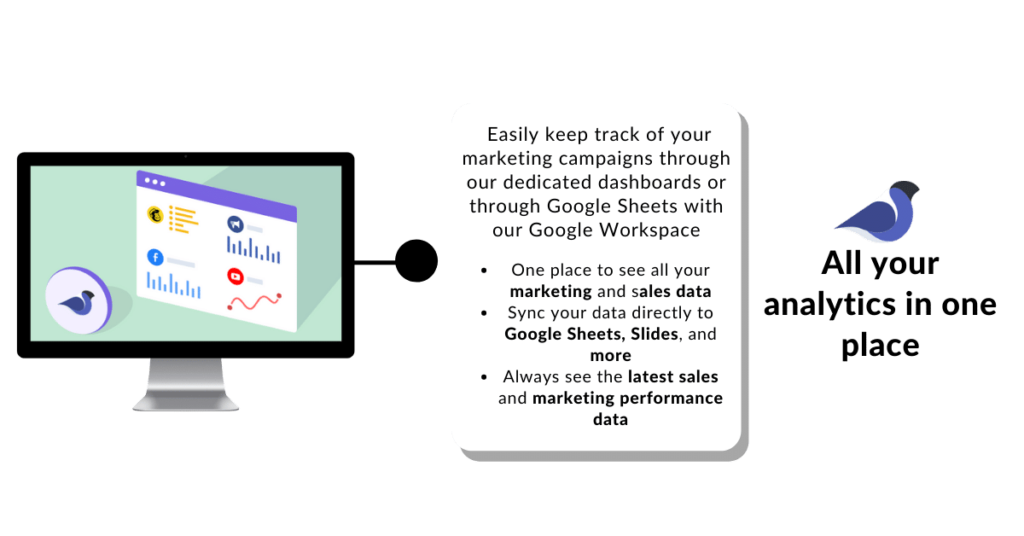
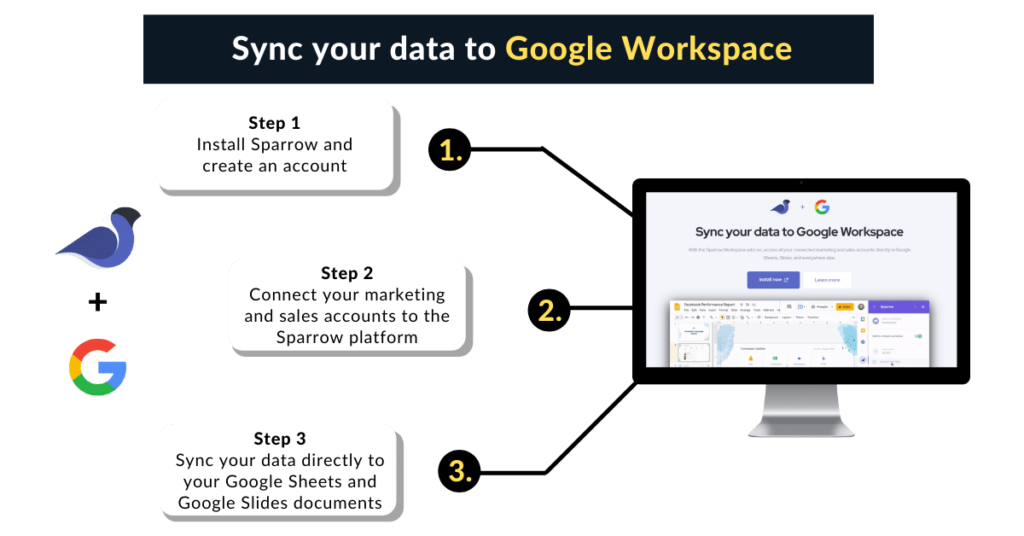
You have to sign in once to see all your marketing and sales data, and you can effortlessly monitor your marketing campaigns through the app’s dedicated dashboards. Users can also track their campaigns through Google Sheets using the Google Workspace function.
In addition, you can sync your data directly to Google Sheets, Slides, etc. Create workspace to manage different accounts effortlessly, retrieve data from major marketing and sales platforms through integration on Sparrow Charts.
One amazing feature of Sparrow Charts is their Teams plan, where you can grant permission to unlimited team members, clients, and contractors who need access to important data.
Sparrow Charts operates a simple user interface for clients to effortlessly navigate the platform and receive regular reports on current sales and marketing performance data.
Unique Features of Sparrow Charts
Sparrow Charts is a unique sales and marketing analytics tool that contains all the necessary features for automatically tracking and sharing client performance.
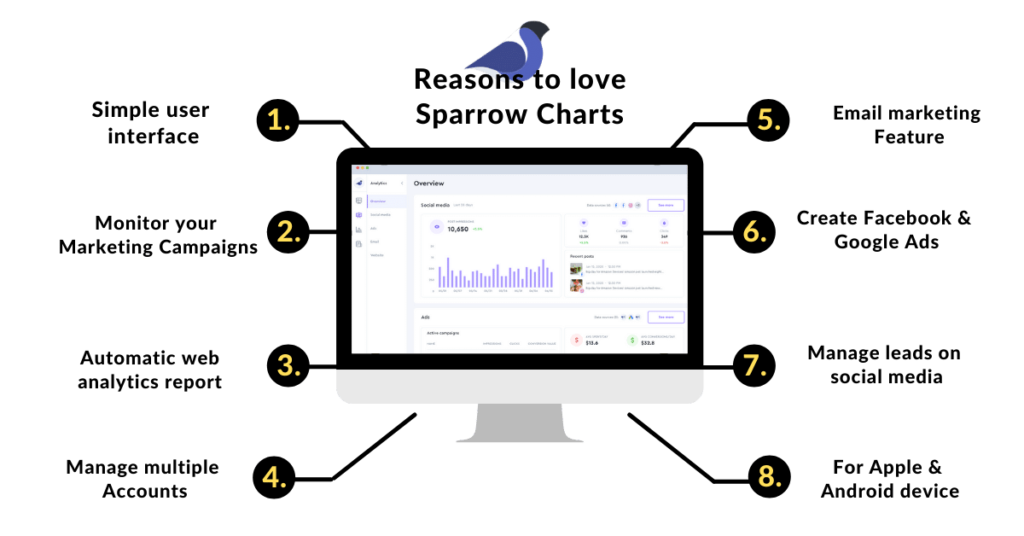
Below are some of the main features:
Free sign-up.
Simple user interface.
Dedicated dashboard, Google Sheets, or Google Workspace for easily monitoring your marketing campaigns.
Automatic web analytics report.
Create Workspaces to manage multiple accounts effectively.
Integrations to easily sync all your data to Google Sheets and Slides.
Teams plan to share data sources with teammates, clients, and contractors.
Email marketing feature.
Create Facebook and Google Ads.
Generate and manage leads on social media.
Compatible with Apple and Android device users.
Pricing
Sparrow Charts offers a 14-day free trial and paid plans. You will need to provide your card details to begin the free trial. No charges occur during the trial period, and users can cancel their plan at any time.
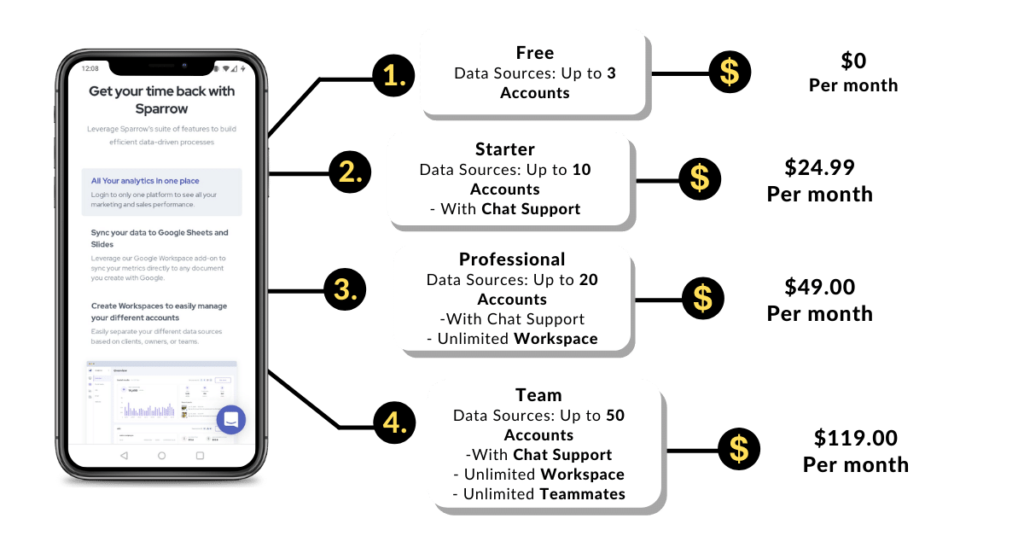
Sparrow Charts free plan is free to download, and users can manage up to three accounts as data sources and get access to chat support.
The starter plan costs $24.99 per month, and users can manage up to 10 accounts and access chat support.
The professional plan costs $49.00 per month, and users can manage up to 20 accounts and access chat support and unlimited workspaces.
Team plan costs $119.00 per month, and users can manage up to 50 accounts, access priority support, get unlimited workspaces and teammates.
When you pay for an annual plan, you get two months for free. Also, if none of the paid plans is sufficient for what you need, you can request a custom plan based on your business needs.
Why Should Users Download Sparrow Charts?
Sparrow Chart is a great choice if you are a business owner, freelancer, or just someone who needs to keep track of their website performance.
Sparrow Chart is one platform where you can track and get your sales and marketing performance reports. You don’t need to open multiple tabs on your computer searching for ways to get accurate reports because Sparrow charts automatically analyze your data and provide fast reports on your online presence performance.
The application also provides a 14 days trial and affordable payment plans based on your business needs. Also, you don’t have to go through the stress of manually inputting data because you can sync your data directly to Google Sheets, Slides, and Docs. Etc.
The integration function allows users to get data from popular marketing and sales platforms such as Facebook, Twitter, Google Ads, Instagram, Google Analytics, Mail Chimp, YouTube, etc.
Sparrow Charts is an ideal software for organizing your data with Workspaces. You can easily manage large amounts of data from various clients or business units simultaneously with no hassle whatsoever.
How to use Sparrow Charts?
Sparrow Charts is simple to use and has an interface to navigate effortlessly. To begin using the application, one has to create an account.
Go to Sparrow Charts website and click the SIGN-UP FOR FREE icon.
Sign up with an existing Google account or fill the form provided with your correct email and create a safe password. Click SIGN-UP after creating your account.
On the welcome homepage, click GET STARTED.
Set up your profile by providing your full name, uploading an avatar for easy identification if you want to, and state your position before clicking NEXT.
Tell Sparrow about yourself by clicking on any available options or type what you choose if the options do not best describe you. Click the NEXT icon to proceed moving forward.
Select a payment plan and click NEXT.
Provide your card details to start your free 14-day free trial.
After providing your details, click START 14-DAY FREE TRIAL, and your trial will begin.
You will be directed to your dashboard. A notification box will pop up on the right side of your screen, where you can check out the Sparrow guide if you need help getting started.
Select DATA SOURCE from the menu icon at the top left of your screen to connect a data source.
Manually upload import data from the IMPORT DATA icon on your dashboard.
Select the settings icon from the menu box to edit your profile, account, workspace, and billing information.
To learn more about the application functionalities, please visit the Sparrow Chart website, scroll downwards and click KNOWLEDGE BASE.
Ratings by TheWebAppMarket
Product Design – 4.9 / 5
User Interface – 4.9 / 5
Ui / UX – 4.9 / 5
Overall Performance – 4.9 / 5
TheWebAppMarket Verdict
Sparrow Charts is a highly effective platform to help users effortlessly manage their sales and marketing data. By utilizing the different features, Sparrow Charts offers, you can easily manage large amounts of data from your clients and monitor the performance of your marketing strategies.
Also, Sparrow Charts will give you automatic regular updates on the performance of your website, social media pages, e-commerce stores, etc. You can easily make improvements based on those reports to perform better and improve your user experience.
If you search for one platform where you can keep track of all your sales and marketing strategies, then Sparrow Charts is a good choice.
TheWebAppMarket is the leading ratings and reviews platform for web apps, mobile apps, software solutions, and digital service providers. Besides offering top-notch online marketing solutions to global brands and startups, we also offer affordable ASO services for app developers. So if you are a fellow app entrepreneur looking to get your app reviewed by TheWebAppMarket, get in touch today.
Similar Apps
Unlock the future of scientific writing with wisio.app – the AI-powered platform trusted by thousands of scientists worldwide. Elevate your research with context-based suggestions, language translation, and the inspiring Magic Mode. Simplify and…
Boost your content creation with LilybankAI, an advanced AI-powered platform that produces creative, high-quality material at breakneck speed. Say goodbye to writer’s block and hello to limitless possibilities. Register right away to transform…
iota-ML can help you realise the promise of hyper-relevance in your marketing plan. Their cutting-edge machine learning technology enables marketers to find useful insights, manage data hygiene, and get information straight to their…
Unlock Your Professional Potential with WriteMyBio! Craft personalized LinkedIn bios that captivate and impress. Elevate your career with our affordable services. Get started now!
MCCX-Drag Racing Game: Experience the thrill of high-speed drag racing with MCCX – Drag Racing Game. With stunning graphics, realistic car mechanics, and immersive gameplay, MCCX delivers an adrenaline-pumping racing experience. Choose from…
Evolup: Supercharge your affiliate marketing success with Evolup – the all-in-one platform combining SEO optimization, Amazon Affiliate integration, and AI-powered automation. Maximize commissions, attract visitors, and streamline operations with Evolup’s intuitive interface and…
TheWebAppMarket presents a list of verified websites working to provide real authenticated instagram followers and many other services to boost your Social Media.
TheWebAppMarket is back with amazing apps that the developer in you would love to use. Read below to know about the top note-taking apps for developers in 2023.
The WebAppMarket is back with amazing video editing websites you would love to use. Give a try to these best video editing websites available today to give your footage a professional look.
TheWebAppMarket brings amazing websites and tools that you need in your daily life but don’t know about! Increase your productivity and creativity with these over-the-top websites!
Softermii is a full-cycle product development company with in-depth expertise in innovative software. Their team implements technology while being focused on your business goals and working in close cooperation with the customer.
TheWebAppMarket presents Miquido, one of the top app development companies offering the best web and mobile services, check out their verified profile with WAM
TheWebAppMarket presents Miquido, one of the top app development companies offering the best web and mobile services, check out their verified profile with WAM
Looking for a flexible and tangible result for your app? Check out the verified profile of Inoxoft Company by TheWebAppMarket and find out all about them.
Being a part of Forbes 30 under 30, Atta.systems is one of the most trusted mobile app development companies. Check out the verified profile of Atta.systems by TheWebAppMarket and find out all about…